1. Introduction
This paper presents four research projects currently underway to
develop new omni-spatial visualization strategies for the collaborative
interrogation of large-scale heterogeneous cultural datasets using the
worlds’ first 360-degree stereoscopic visualization environment
(Advanced Visualization and Interaction Environment – AVIE). The AVIE
system enables visualization modalities through full body immersion,
stereoscopy, spatialized sound and camera-based tracking. The research
integrates groundbreaking work by a renowned group of international
investigators in virtual environment design, immersive interactivity,
information visualization, museology, visual analytics and computational
linguistics. The work is being implemented at the newly established
world-leading research facility, City University’s Applied Laboratory
for Interactive Visualization and Embodiment – ALIVE) in association
with partners Museum Victoria (Melbourne), iCinema Centre, UNSW
(Sydney), ZKM Centre for Art and Media (Karlsruhe), UC Berkeley (USA),
UC Merced (USA) and the Dharma Drum Buddhist College (Taiwan). The
applications are intended for museum visitors and for humanities
researchers. They are: 1) Data Sculpture Museum; 2) Rhizome of the Western Han; 3) Blue Dots (Tripitaka Koreana) and, 4) the Social Networks of Eminent Buddhists
(Biographies from Gaoseng Zhuan). The research establishes new
paradigms for interaction with future web-based content as situated
embodied experiences.
The rapid growth in participant culture embodied by Web2.0 has seen
creative production overtake basic access as the primary motive for
interaction with databases, archives and search engines (Manovich 2008).
The meaning of diverse bodies of data is increasingly expressed through
the user’s intuitive exploration and re-application of that data,
rather than simply access to information (NSF 2007). This demand for
creative engagement poses significant experimental and theoretical
challenges for the memory institutions and the storehouse of cultural
archives (Del Favero et al. 2009). The structural model that has emerged
from the Internet exemplifies a database paradigm where accessibility
and engagement is constrained to point and click techniques where each
link is the node of interactivity. Indeed, the possibility of more
expressive potentials for interactivity and alternative modalities for
exploring and representing data has been passed by, largely ignored
(Kenderdine 2010). In considering alternatives, this paper explores
situated experiments emerging from the expanded cinematic that
articulate for cultural archives a reformulation of database
interaction, narrative recombination and analytic visualization.
The challenges of what can be described as cultural data sculpting
following from Zhao & Van Moere’s ‘data sculpting’ (2008) are
currently being explored at a new research facility, the Applied
Laboratory of Interactive Visualization and Embodiment (ALiVE),
co-directed by Dr. Sarah Kenderdine and Prof. Jeffrey Shaw (http://www.cityu.edu.hk/alive).
It has been established under the auspices of CityU Hong Kong and is
located at the Hong Kong Science Park (http://www.hkstp.org). ALiVE
builds on creative innovations that have been made over the last ten
years at the UNSW iCinema Research Centre, at the ZKM Centre for Art and
Media, and at Museum Victoria. ALiVE has a transdisciplinary research
strategy. Core themes include aesthetics of interactive narrative;
kinaesthetic and enactive dimensions of tangible and intangible cultural
heritage; visual analytics for mass heterogeneous datasets; and
immersive multi-player exertion-based gaming. Embedded in the title of
ALiVE are the physicality of data and the importance of sensory and
phenomenological engagement in an irreducible ensemble with the world.
Laboratories such as ALiVE can act as nodes of the cultural imaginary
of our time. Throughout the arts and sciences, new media technologies
are allowing practitioners the opportunity for cultural innovation and
knowledge transformation. As media archaeologist Siegfried Zielinski
says, the challenge for contemporary practitioners engaged with these
technologies is not to produce “more cleverly packaged information of
what we know already, what fills us with ennui, or tries to harmonize
what is not yet harmonious” (Zielinski 2006, p.280). Instead, Zielinski
celebrates those who, inside the laboratories of current media praxis,
“understand the invitation to experiment and to continue working on the
impossibility of the perfect interface” (Zielinski 2006, p.259). To
research the ‘perfect interface’ is to work across heterogeneity and to
encourage “dramaturgies of difference” (Zielinski 2006, p.259).
Zielinski also calls for ruptures in the bureaucratization of the
creative and cultural industries of which museums are key stakeholders.
At the intersections of culture and new technologies, Zielinski
observes that the media interface is both: “…poetry and techne capable
of rendering accessible expressions of being in the world, oscillating
between formalization and computation, and intuition and imagination”
(Zielinski 2006, p.277). And as philosopher Gaston Bachelard describes
in L’Invitation au Voyage, imagination is not simply about the forming of images; rather:
… the faculty of deforming the images, of freeing ourselves from the immediate images; it is especially the faculty of changing images. If there is not a changing of images, an unexpected union of images, there is no imagination, no imaginative action. If a present image does not recall an absent
one, if an occasional image does not give rise to a swarm of deviant
images, to an explosion of images, there is no imagination… The
fundamental work corresponding to imagination is not image but the imaginary. The value of an image is measured by the extent of its imaginary radiance or luminance. (Bachelard 1971/1988, p.19)
This paper documents the challenge of designing forms of new cultural
expression in the cultural imaginary using databases of cultural
materials. It also investigates new forms of scholarly access to
large-scale heterogeneous data. It describes this research as it has
been realized in the world’s first 360-degree interactive stereographic
interface, the Applied Visualization Interaction Environment (AVIE). The
four experimental projects included in this paper draw upon disciplines
such as multimedia analysis, visual analytics, interaction design,
embodied cognition, stereographics and immersive display systems,
computer graphics, semantics and intelligent search and, computational
linguistics. The research also investigates media histories,
recombinatory narrative, new media aesthetics, socialization and
presence in situated virtual environments, and the potential for a
psycho geography of data terrains. The datasets used in these four works
are:
1. Data Sculpture Museum: over 100,000 multimedia rich
heterogeneous museological collections covering arts and sciences
derived from the collections of Museum Victoria, Melbourne and ZKM
Centre for Art and Media, Karlsruhe. For general public use in a museum
contexts.
2. Rhizome of the Western Han: laser-scan archaeological
datasets from two tombs and archaeological collections of the Western
Han, Xian, China culminating in a metabrowser and interpretive cybermap.
For general public use in a museum contexts.
3. Blue Dots: Chinese Buddhist Canon, Koryo version
(Tripitaka Koreana) in classical Chinese, the largest single corpus with
52 million glyphs carved on 83,000 printing blocks in 13th century
Korea. The digitized Canon contains metadata that link to geospatial
positions, to contextual images of locations referenced in the text, and
to the original rubbings of the wooden blocks. Each character has been
abstracted to a ‘blue dot’ to enable rapid search and pattern
visualization. For scholarly use and interrogation.
4. Social Networks of Eminent Chinese Buddhists: in which the visualization is based on the Gaoseng zhuang corpus. For scholarly use and interrogation.
To contextualize these projects, this paper begins by briefly
introducing the rationale for the use of large-scale immersive display
systems for data visualization, together with a description of the AVIE
display system. Several related research demonstrators are described as
background for the aforementioned projects currently underway at ALiVE.
The paper also includes brief accounts of multimedia analysis, visual
analytics and text visualization as emerging and fast developing fields
applied to large-scale datasets and heterogeneous media formats, as
techniques applicable to cultural datasets.
2. Culture@Large
Advanced Visualization and Interaction Environment
Applied Visualization Interaction Environment (AVIE) is the UNSW
iCinema Research Centre’s landmark 360-degree stereoscopic interactive
visualization environment. The base configuration is a cylindrical
projection screen 4 meters high and 10 meters in diameter, a 12-channel
stereoscopic projection system and a 14.2 surround sound audio system.
AVIE’s immersive mixed reality capability articulates an embodied
interactive relationship between the viewers and the projected
information spaces (Figure 1). It uses active stereo projection solution
and camera tracking. (For a full technical description, see McGinity et
al. 2007).
 Fig 1: Advanced Visualization and Interaction Environment (AVIE) © UNSW iCinema Research Centre. Image: ALiVE 2010
Embodied Experiences
The research projects under discussion in this paper are predicated
on the future use of real-time Internet delivered datasets in
large-scale virtual environments, facilitating new modalities for
interactive narrative and new forms of scholarship. The situated spaces
of immersive systems provide a counterpoint to the small-scale desktop
delivery and distributed consumption of internet-deployed cultural
content. New museology has laid the foundations for many of the museums
we see today as ‘zones of contact’, places of ‘civic seeing’ (Bennett
2006, pp. 263-281), and engagements with poly-narratives and dialogic
experience. The immersive display system AVIE encourages physical
proximity, allowing new narrative paradigms to emerge from interactivity
and physical relationships. Situated installations allow for
human-to-human collaborative engagements in the interrogation of
cultural material and mediations of virtual worlds. The physical
proximity of the participants has a significant influence on the
experiences of such installations (Kenderdine & Schettino 2010,
Kenderdine & Shaw 2009, Kenderdine et al. 2009).
For online activity, shared socialization of searching cultural data
such as social media involving non-specialist tagging of cultural
collection data (Chan 2007; Springer et al. 2008) is still largely
contained within a 2D flat computer screen. In the case of social
tagging, the impersonal, invisible characteristics of the medium deny
the inhibiting aspect of physical distance. Studies of human experiences
demonstrate that perception implies action, or rather interaction,
between subjects (Maturana & Varela 1980). Knowledge is a process
that is inherently interactive, communicative and social (Manghi 2004).
Elena Bonini, researcher in digital cultural heritage, describes the
process:
All art works or archaeological findings are not
only poetic, historical and social expressions of some peculiar human
contexts in time and space, but are also [the] world’s founding acts.
Every work of art represents an original, novel re-organization of the
worlds or a Weltanschauung… aesthetic experience creates worlds of
meaning (Bonini 2008, p.115).
Research into new modalities of visualizing data is essential for a
world producing and consuming digital data at unprecedented rates (Keim
et al., 2006; McCandless, 2010). Existing techniques for interaction
design in visual analytics rely upon visual metaphors developed more
than a decade ago (Keim et al. 2008), such as dynamic graphs, charts,
maps, and plots. Currently, interactive, immersive and collaborative
techniques to explore large-scale datasets lack adequate experimental
development essential to the construction of knowledge in analytic
discourse (Pike et al. 2009). Recent visualization research remains
constrained to 2D small-screen-based analysis and advances interactive
techniques of “clicking”, “dragging” and “rotating” (Lee et al. 2009,
Speer et al. 2010, p.9). Furthermore, the number of pixels available to
the user remains a critical limiting factor in human cognition of data
visualizations (Kasik et al., 2009). The increasing trend towards
research requiring ‘unlimited’ screen resolution has resulted in the
recent growth of gigapixel displays. Visualization
systems for large-scale data sets are increasingly focused on
effectively representing their many levels of complexity. This includes
tiled displays such as HIPerSpace at Calit2 (http://vis.ucsd.edu/mediawiki/index.php/Research_Projects:_HIPerSpace)
and, next generation immersive virtual reality systems such as StarCAVE
(UC San Diego, De Fanti et al. 2009) and Allosphere at UC Santa Barbara
(http://www.allosphere.ucsb.edu/).
In general, however, the opportunities
offered by interactive and 3D technologies for enhanced cognitive
exploration and interrogation of high dimensional data still need to be
realized within the domain of visual analytics for digital humanities
(Kenderdine, 2010). The projects described in this paper take on these
core challenges of visual analytics inside AVIE to provide powerful
modalities for an omni-directional (3D, 360-degree) exploration of
multiple heterogeneous datasets responding to the need for embodied
interaction; knowledge-based interfaces, collaboration, cognition and
perception (as identified in Pike et al., 2009). A framework for
‘enhanced human higher cognition’ (Green, Ribarsky & Fisher 2008) is
being developed that extends familiar perceptual models common in
visual analytics to facilitate the flow of human reasoning. Immersion in
three-dimensionality representing infinite data space is recognized as a
pre-requisite for higher consciousness, autopoesis (Maturana &
Varela, 1980) and promotes non-vertical and lateral thinking (see
Nechvatal, 2009). Thus, a combination of algorithmic and human
mixed-initiative interaction in an omni-spatial environment lies at the
core of the collaborative knowledge creation model proposed.
The four projects discussed also leverage the potential inherent in a
combination of ‘unlimited screen real-estate’, ultra-high stereoscopic
resolution and 360-degree immersion to resolve problems of data
occlusion and distribute the mass of data analysis in networked
sequences revealing patterns, hierarchies and interconnectedness. The
omni-directional interface prioritizes ‘users in the loop’ in an
egocentric model (Kasik, et al. 2009). The projects also expose what it
means to have embodied spherical (allocentric) relations to the
respective datasets. These hybrid approaches to data representation also
allow for the development of sonification strategies to help augment
the interpretation of the results. The tactility of data is enhanced in
3D and embodied spaces by attaching audio to its abstract visual
elements and has been well defined by researchers since Chion and others
(1994). Sonification reinforces spatial and temporal relationships
between data (e.g. the object’s location in 360-degrees/infinite 3D
space and its interactive behavior; for example, see West et al., 2008).
The multi-channel spatial array of the AVIE platform offers
opportunities for creating a real-time sonic engine designed
specifically to enhance cognitive and perceptual interaction, and
immersion in 3D. It also can play a significant role in narrative
coherence across the network of relationships evidenced in the datasets.
3. Techniques for Data Analysis and Visualization
Multimedia Analysis
This short section introduces the intersection of key disciplines
related to the projects in this paper. Multimedia analysis in the recent
past has generally focused on video, images, and, to some extent,
audio. An excellent review of the state of the art appeared in IEEE Computer Graphics and Applications
(Chinchor et al. 2010). Multimedia Information Retrieval is at the
heart of computer vision, and as early as the 1980s, image analysis
included things such as edge finding, boundary and curve detection,
region growing, shape identification, feature extraction and so on.
Content based information retrieval in the 1990s for images and video
became a prolific area of research, directed mainly at scholarly use. It
was with the mass growth of Internet based multimedia for general
public use that the research began to focus onf human-centric tools for
content analysis and retrieval (Chinchor et al. 2010, p.52). From the
mid-1990s, image and video analysis included colour, texture, shape and
spatial similarities. Video parsing topics include segmentation, object
motion analysis framing, and scene analysis. Video abstraction
techniques include skimming, key frame extraction, content-based
retrieval of clips, indexing and annotation (e.g. Aigrain et al. 1996).
Other researchers attempt to get semantic analysis from multimedia
content. Michel Lew and colleagues try to address the semantic gap by
“translating the easily computable low-level content-based media feature
to high level concepts or terms intuitive to users” (cited in Chinchor
et al. 2010, p.54). Other topics such as similarity matching,
aesthetics, security, and storytelling have been the focus of research
into web-based multimedia collections (Datta et al. 2008). Also, shot
boundary detection, face detection and content-based 3D shape retrieval
have been the focus of recent research (respectively Leinhart 2001; Yang
et al. 2002; Tangelder & Veltkamp 2004). A notable project for
multimedia analysis for the humanities is Carnegie Mellon University’s
Informedia project (Christel 2009 (www.informedia.cs.cmu.edu))
that uses speech, image and language processing to improve the
navigation of a video and audio corpora (The HistoryMakers
African-American oral history archive (http://www.idvl.org/thehistorymakers/)
& NIST TRECVIC broadcast news archive). However, it is generally
agreed that research in this area is application specific and robust,
and automatic solutions for the whole domain of media remain largely
undiscovered (Chinchor et al. 2010, p.55).
Visual analytics
In the last five years, the visual analytics field has grown
enormously, and its core challenges for the upcoming five years are
clearly articulated (Thomas & Kielman 2009; Pike et al. 2009).
Visual Analytics includes associated fields of Scientific Visualization,
Information Visualization and Knowledge Engineering, Data Management
and Data Mining, as well as Human Perception and Cognition. The research
agenda of Visual Analytics addresses the science of analytics
reasoning, visual representation and interaction techniques, data
representation and transformations, presentation, production and
dissemination (Thomas & Kielman 2009, p.309). Core areas of
development have included business intelligence, market analysis,
strategic controlling, security and risk management, health care and
biotechnology, automotive industry, environment and climate research, as
well as other disciplines of natural, social, and economic sciences.
In the humanities, Cultural Analytics as
developed by UC San Diego uses computer-based techniques for
quantitative analysis and interactive visualization employed in sciences
to analyze massive multi-modal cultural data sets on gigapixels screens
(Manovich 2009). The project draws upon cutting-edge
cyberinfrastructure and visualization research at Calit2. Visual
analytics was referred to as one of the upcoming key technologies for
research with adoption of 4-5 years in the Horizon Report (2010). While
visual data analysis was not mentioned in the Museum edition of the
Horizon report (2010), I would argue that it represents techniques
fundamental to the re-representation of museological collections (online
and offline).
Text visualization
Research into new modalities of visualizing data is essential for a
world producing and consuming digital data (which is predominantly
textual data) at unprecedented scales (McCandless 2010; Keim 2006).
Computational linguistics is providing many of the analytics tools
required for the mining of digital texts (e.g. Speer et al. 2010; Thai
& Handschuh 2010) The first international workshop for intelligent
interface to text visualization only recently took place in Hong Kong,
2010 (Lui et al. 2010). Most previous work in text visualization focused
on one of two areas: visualizing repetitions, and visualizing
collocations. The former shows how frequently, and where, particular
words are repeated, and the latter describes the characteristics of the
linguistic “neighborhood” in which these words occur. Word clouds are a
popular visualization technique whereby words are shown in font sizes
corresponding to their frequencies in the document. It can also show
changes in frequencies of words through time (Havre et al. 2000) and in
different organizations (Collins et al. 2009), and emotions in different
geographical locations (Harris & Kamvar 2009). The significance of a
word also lies in the locations at which it occurs. Tools such as TextArc (Paley 2002), Blue Dots (Lancaster 2007, 2008a, 2008b) and Arc Diagrams
(Wattenberg 2002) visualize these “word clusters” but are constrained
by the small window size of a desktop monitor. In a concordance or
“keyword-in-context” search, the user supplies one or more query words,
and the search engine returns a list of sentence segments in which those
words occur. IBM’s Many Eyes (http://www.manyeyes.alphaworks.ibm.com)
displays the context with suffix trees, thereby visualizing the most
frequent n-grams following a particular word. In the digital humanities,
use of words and text strings is the typical mode of representation of
mass corpora. However, new modes of lexical visualization such as Visnomad (http://www.visnomad.org) are emerging as dynamic visualization tools for comparing one text with another. In another example, the Visualization of the Bible
by Chris Harrison, each of the 63,779 cross references found in the
Bible is depicted by a single arc whose color corresponds to the
distance between the two chapters (Harrison & Romhild 2008).
4. Cultural Data Sculpting
This section details prior work by the researcher partners dealing with large-scale video archives (iCinema Centre, T_Visionarium I & II 2003; 2008; Open City 2009) and the real-time delivery of Wikipedia pages and image retrieval from the Internet (ZKM, Crowdbrowing,
2008). All projects were delivered in large-scale museum-situated
panoramic or spherical projection systems. The paper then goes on to
describe the current works under production at ALiVE.
Previous work
T_Visionarium
T_Visionarium I was developed by iCinema Centre, UNSW in
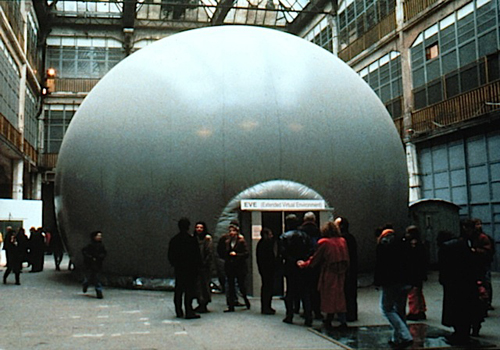
2003. It takes place in the Jeffrey Shaw’s EVE dome (Figure 2), an
inflatable (12 meters by 9 meters). Upon entering the dome, viewers
place position-tracking devices on their heads. The projection system is
fixed on a motorized pan tilt apparatus mounted on a tripod. The
database used here was recorded during a week-long period from 80
satellite television channels across Europe. Each channel plays
simultaneously across the dome; however, the user directs or reveals any
particular channel at any one time. The matrix of ‘feeds’ is tagged
with different parameters – keywords such as phrases, color, pattern,
and ambience. Using a remote control, each viewer selects options from a
recombinatory search matrix. On selection of a parameter, the matrix
then extracts and distributes all the corresponding broadcast items of
that parameter over the entire projection surface of the dome. For
example, selecting the keyword “dialogue” causes all the broadcast data
to be reassembled according to this descriptor. By head turning, the
viewer changes the position of the projected image, and shifts from one
channel’s embodiment of the selected parameter to the next. In this way,
the viewer experiences a revealing synchronicity between all the
channels linked by the occurrence of keyword tagged images. All these
options become the recombinatory tableau in which the original data is
given new and emergent fields of meaning (Figure 3).
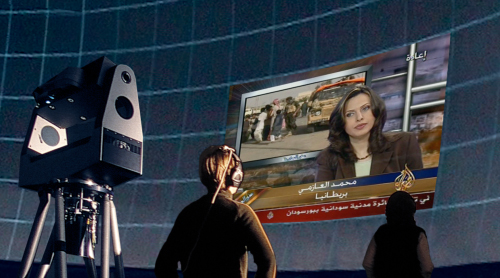 Fig 3: T_Visionarium I © UNSW iCinema Research Centre
T_Visionarium II (produced as part of the ARC Discovery,
‘Interactive Narrative as a Form of Recombinatory Search in the
Cinematic Transcription of Televisual Information’) uses 24 hours of
free-to-air broadcast TV footage from 7 Australian channels as its
source material. This footage was analyzed by software for changes of
camera angle, and at every change in a particular movie (whether it be a
dramatic film or a sitcom), a cut was made, resulting in a database of
24,000 clips of approx. 4 seconds each. Four researchers were employed
to hand tag each 4 second clip with somewhat idiosyncratic metadata
related to the images shown, including emotion; expression; physicality;
scene structure; with metatags including speed; gender; colour; and so
on. The result is 500 simultaneous video streams looping each 4 seconds,
and responsive to a user’s search (http://www.icinema.unsw.edu.au/projects/prj_tvis_II_2.html) (Figures 4 & 5).
 Fig 4: T_Visionarium II in AVIE © UNSW iCinema Research Centre
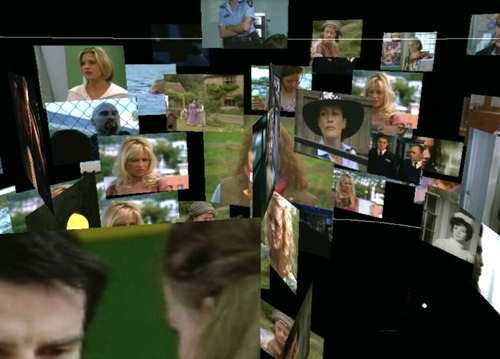 Fig 5: Close of the dataspace, T_Visionarium II © UNSW iCinema Research Centre
An antecedent of the T_Visionarium projects can be found in Aby Warburg’s, Mnemosyne,
a visual cultural atlas, a means of studying the internal dynamics of
imagery at the level of its medium rather than its content, performing
image analysis through montage and recombination. T_Visionarium
can be framed by the concept of aesthetic transcription; that is, the
way new meaning can be produced is based on how content moves from one
expressive medium to another. The digital allows the transcription of
televisual data, decontextualising the original and reconstituting it
within a new artifact. As the archiving abilities of the digital allow
data to be changed from its original conception, new narrative
relationships are generated between the multitudes of clips, and
meaningful narrative events emerge because of viewer interaction in a
transnarrative experience where gesture is all-defining. The
segmentation of the video reveals something about the predominance of
close-ups, the lack of panoramic shots, the heavy reliance on dialogue
in TV footage. These aesthetic features come strikingly to the fore in
this hybrid environment. The spatial contiguity gives rise to news ways
of seeing, and of reconceptualising in a spatial montage (Bennett 2008).
In T_Visionarium the material screen no longer exists (Figure
6). The boundary of the cinematic frame has been violated, hinting at
the endless permutations that exist for the user. Nor does the user
enter a seamless unified space; rather, he or she is confronted with the
spectacle of hundreds of individual streams. Pannini’s picture
galleries also hint at this infinitely large and diverse collection,
marvels to be continued beyond the limits of the picture itself.
 Fig 6: Datasphere, T_Visionarium II © UNSW iCinema Research Centre
Open City
The T’Visionarium paradigm was also recently employed for OPEN CITY,
as part of the 4th International Architecture Biennale in Rotterdam
& the International Documentary Film Festival of Amsterdam, in 2009.
Via the program Scene-Detector, all 450 documentary films were
segmented into 15,000 clips. Categories and keywords here were related
in some way to the thematic of the Biennial and included tags such as
rich/poor, torn city, alternative lifestyles, religion, aerial views,
cityscapes, highrise, green, public/open, transport, slums. Also, time,
location, and cinematographic parameters such as riders, close-up, black
and white, color, day, night, were used to describe the footage (Figure
7).
 Fig 7: Open City © UNSW iCinema Research Centre. Image: VPRO
Crowdbrowsing
The interactive installation CloudBrowsing (2008-09) was one of the first works to be developed and shown in ZKM’s recently established PanoramaLab (Crowdbrowsing ZKM 2008b). The project lets users experience Web-based information retrieval in a new way:
Whereas our computer monitor only provides a
restricted frame, a small window through which we experience the
multilayered information landscape of the Net only partially and in a
rather linear mode, the installation turns browsing the Web into a
spatial experience: Search queries and results are not displayed as
text-based lists of links, but as a dynamic collage of sounds and
images. (Crowdbrowsing ZKM 2008b)
In the current version of the project (Figures 8, 9 & 10), the user browses the free online encyclopedia Wikipedia.
A filter mechanism ensures that only open content is displayed in the
installation. The cylindrical surface of the 306-degree PanoramaScreen
becomes a large-scale browser surrounding the user, who can thus
experience a panorama of his movements in the virtual information space.
 Fig 8: Wikipedia pages, Crowdbrowsing © ZKM
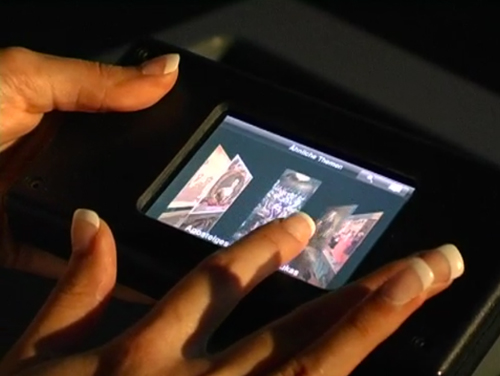 Figure 10: Crowdbrowsing: interface control © ZKM
Current work
Data Sculpture Museum
This project is being developed as part of the Australian Research
Council Linkage Grant (2011 – 2014) for “The narrative reformulation of
multiple forms of databases using a recombinatory model of cinematic
interactivity” (UNSW iCinema Research Centre, Museum Victoria, ALiVE,
City University, ZKM Centre for Built Media). The aim of this research
is to investigate re-combinatory search, transcriptive narrative and
multimodal analytics for heterogeneous datasets through their
visualization in a 360° stereoscopic space (Del Favero et al. 2009).
Specifically, the exploration of re-combinatory search of cultural data
(as a cultural artefact) as an interrogative, manipulable and
transformative narrative, responsive to and exposing multiple narrations
that can be arranged and projected momentarily (Deleuze, 1989) over
that which is purposefully embedded and recorded in the architecture of
data archive and metadata, and witnessed (Ricoeur 2004). This project
builds upon the exploration and gains made in the development of T_Visionarium.
The datasets used include over 100,000 multimedia rich records
(including audio files, video files, high resolution monoscopic and
stereoscopic images, panoramic images/movies, and text files) from
Museum Victoria and the media art history database of the ZKM (http://on1.zkm.de/zkm/e/institute/mediathek/)
that include diverse subject areas from the arts and sciences
collections. The data are collated from collection management systems
and from web-based and exhibition-based projects. Additional metadata
and multimedia analysis will be used to allow for intelligent searching
across datasets. Annotation tools will provide users with the ability to
make their own pathways through the data terrain, a psycho geography of
the museum collections. Gesture-based interaction will allow users to
combine searches, using both image-based and text input methods. Search
parameters include:
- Explicit (keyword search based on collections data and extra metadata tags added using the project),
- Multimedia (e.g. show me all faces like this face; show me all videos on Australia, show me everything pink!),
- Dynamic (e.g. show me the most popular search items; join my search
to another co-user; record my search for others to see; add tags).
This project seeks understanding in the developments of media
aesthetics. Problems of meaningful use of information are related to the
way users integrate the outcomes of their navigational process into
coherent narrative forms. In contrast to the interactive screen based
approaches conventionally used by museums, this study examines the
exploratory strategies enacted by users in making sense of large-scale
databases when experienced immersively in a manner similar to that
experienced in real displays (Latour 1988). In particular, evaluation
studies will ask:
- How do museum users interact with an immersive 360-degree data
browser that enables navigational and editorial choice in the
re-composition of multi-layered digital information? - Do the outcomes of choices that underpin editorial re-composition of
data call upon aesthetic as well as conceptual processes and in what
form are they expressed? (Del Favero et al. 2009)
The recent advent of large-scale immersive systems has significantly
altered the way information can be archived, accessed and sorted. There
is significant difference between museum 2D displays that bring
pre-recorded static data into the presence of the user, and immersive
systems that enable museum visitors to actively explore dynamic data in
real-time. The experimental study into the meaningful use of data
involves the development of an experimental browser capable of engaging
users by enveloping them in an immersive setting that delivers
information in a way that can be sorted, integrated and represented
interactively. Specifications of the proposed experimental data browser
include:
- immersive 360-degree data browser presenting multi-layered and heterogeneous data
- re-compositional system enabling the re-organization and authoring of data
- scalable navigational systems incorporating Internet functions
- collaborative exploration of data in a shared immersive space by multiple users
- intelligent interactive system able to analyze and respond to users’ transactions.
Rhizome of the Western Han
This project investigates the integration of high resolution
archaeological laser scan and GIS data inside AVIE. This project
represents a process of archaeological recontextualization, bringing
together remote sensing data from the two tombs (M27 & The Bamboo
Garden) with laser scans of funerary objects, in a spatial context
(Figure 11, 12 & 13). This prototype builds an interactive narrative
based on spatial dynamics, and cultural aesthetics and philosophies
embedded in the archaeological remains. The study of Han Dynasties (206
BC-220 A.D.) imperial tombs has always been an important field of
Chinese archaeology. However, only a few tombs of the West Han Dynasty
have been scientifically surveyed and reconstructed. Further, the
project investigates a reformulation of narrative based on the
application of cyber mapping principles in archaeology (Forte 2010;
Kurillo et al. 2010).
 Fig 11: Rhizome of the Western Han: inhabiting the tombs at 1:1 scale © ALiVE, CityU
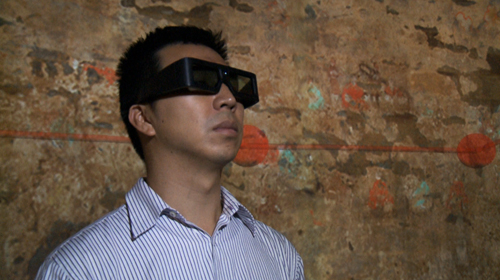 Fig 12: Rhizome of the Western Han: iconographic hotspots © ALiVE, CityU
 Fig 13: Rhizome of the Western Han: image browser © ALiVE, CityU
There is ample discourse to situate the body at the forefront of
interpretive archaeology research as a space of phenomenological
encounter. Post-processual frameworks for interpretive archaeology
advance a phenomenological understanding of the experience of landscape.
In his book, Body and Image: Explorations in Landscape Phenomenology,
archaeologist Christopher Tilley, for example, usefully contrasts
iconographic approaches to the study of representation with those of
kinaesthetic enquiry. Tilley’s line of reasoning provides grounding for
the research into narrative agency in large-scale, immersive and
sensorial, cognitively provocative environments (Kenderdine, 2010). This
project examines a philosophical discussion of what it means to inhabit
archaeological data ‘at scale’ (1:1). It also re-situates the theatre
of archaeology in a fully immersive display system, as “the
(re)articulation of fragments of the past as real-time event” (Pearson
& Shanks 2001).
Blue Dots
This project integrates the Chinese Buddhist Canon, Koryo version
Tripitaka Koreana, into the AVIE system (a project between ALiVE, City
University Hong Kong and UC Berkeley). This version of the Buddhist
Canon is inscribed as UNESCO World Heritage enshrined in Haeinsa, Korea.
The 166,000 pages of rubbings from the wooden printing blocks
constitute the oldest complete set of the corpus in print format
(Figures 14 & 15). Divided into 1,514 individual texts, the version
has a complexity that is challenging since the texts represent
translations from Indic languages into Chinese over a 1000-year period
(2nd-11th centuries). This is the world’s largest single corpus
containing over 50 million glyphs, and it was digitized and encoded by
Prof Lew Lancaster and his team in a project that started in the 70s
(Lancaster 2007, 2008a, 2008b).
 Fig 14: Tripitaka Koreana © Korean Times (http://www.koreatimes.co.kr/www/news/art/2010/03/293_61805.html)
 Fig 15: Tripitaka Koreana © Korean Times (http://www.koreatimes.co.kr/www/news/art/2010/03/293_61805.html)
The Blue Dots (http://ecai.org/textpatternanalysis/)
project undertaken at Berkeley as part of the Electronic Cultural Atlas
Initiative (ECAI) abstracted each glyph from the Canon into a blue dot,
and gave metadata to each of these Blue Dots, allowing vast searches to
take place in minutes rather than scholarly years. In the search
function, each blue dot also references an original plate photograph for
verification. The shape of these wooden plates gives the blue dot array
its form (Figure 16). As a searchable database, it exists in a
prototype form on the Internet (currently unavailable). Results are
displayed in a dimensional array where users can view and navigate
within the image. The image uses both the abstracted form of a ‘dot’ as
well as color to inform the user of the information being retrieved.
Each blue dot represents one glyph of the dataset. Alternate colors
indicate the position of search results. The use of color, form, and
dimension for fast understanding of the information is essential for
large data sets where thousands of occurrences of a target word/phrase
may be seen. Analysis across this vast text retrieves visual
representations of word strings, clustering of terms, automatic analysis
of ring construction, viewing results by time, creator, and place. The Blue Dots
method of visualization is a breakthrough for corpora visualization and
lies at the basis of the visualization strategies of abstraction
undertaken in this project. The application of an omni-spatial
distribution of this text solves problems of data occlusion, and
enhances network analysis techniques to reveal patterns, hierarchies and
interconnectedness (Figures 17 & 18). Using a hybrid approach to
data representation, audification strategies will be incorporated to
augment interaction coherence and interpretation. The data browser is
designed to function in two modes: the Corpus Analytics mode for text
only, and the Cultural Atlas mode that incorporates original texts,
contextual images and geospatial data. Search results can be saved and
annotated.
 Fig 16: Blue Dots: abstraction of characters to dots and pattern arrays © ECAI, Berkeley
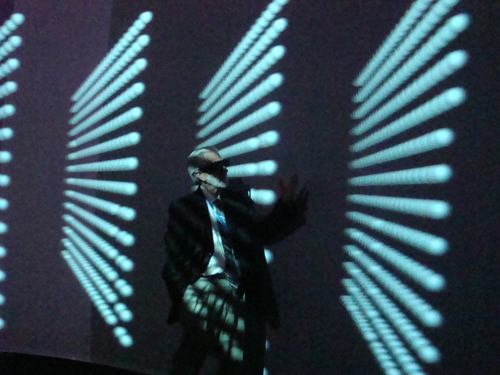 Fig 17: Prof Lew Lancaster interrogates the prototype of Blue Dots AVIE © ALiVE, CityU. Image: Howie Lan
 Fig 18: Close up of blue dots & corresponding texts, prototype of Blue Dots AVIE © ALiVE, CityU. Image: Howie Lan
The current search functionality ranges from visualizing word
distribution and frequency, to revealing other structural patterns such
as the chiastic structure and ring compositions. In the Blue Dots
AVIE version, the text is also visualized as a matrix of simplified
graphic elements representing each of the words. This will enable users
to identify new linguistic patterns and relationships within the matrix,
as well as access the words themselves and related contextual
materials. The search queries will be applied across multiple languages,
accessed collaboratively by researchers, extracted and saved for later
re-analysis.
The data provide an excellent resource for the study of dissemination
of documents over geographic and temporal spheres. Additional metadata,
such as present day images of the monasteries where the translation
took place, will be included in the data array. The data will also be
sonified. The project will design new omni-directional metaphors for
interrogation and the graphical representation of complex relationships
between these textual datasets to solve the significant challenges of
visualizing both abstract forms and close-up readings of this rich data.
In this way, we hope to set benchmarks in visual analytics, scholarly
analysis in the digital humanities, and the interpretation of classical
texts
Social Networks of Eminent Buddhists
This visualization of social networks of Chinese Buddhists is based
on the Gaoseng zhuang corpus produced at the Digital Archives Section of
Dharma Drum Buddhist College, Taiwan (http://buddhistinformatics.ddbc.edu.tw/biographies/socialnetworks/interface/).
The Gaoseng zhuan corpus contains the biographies of eminent Buddhists
between the 2nd and 17th century. The collections of hagio-biographies
of eminent Buddhist monks and nuns are one of the most interesting
sources for the study of Chinese Buddhism. These biographies offer a
fascinating glance into the lives of religious professionals in China
between c. 200 and 1600 CE. In contrast to similar genres in India or
Europe, the Chinese hagio-biographies do not, in the main, emphasize
legend, but, following Confucian models of biographical literature, are
replete with datable historical facts. The project uses TEI
to markup the four most important of these collections, which together
contain more than 1300 hagio-biographies. The markup identifies person
and place names as well as dates (http://buddhistinformatics.ddbc.edu.tw/biographies/gis/).
It further combines these into nexus points to describe events of the
form: one or more person(s) were at a certain time at a certain place
(Hung et al. 2009; Bingenheimer et al. 2009; Bingenheimer et al. 2011).
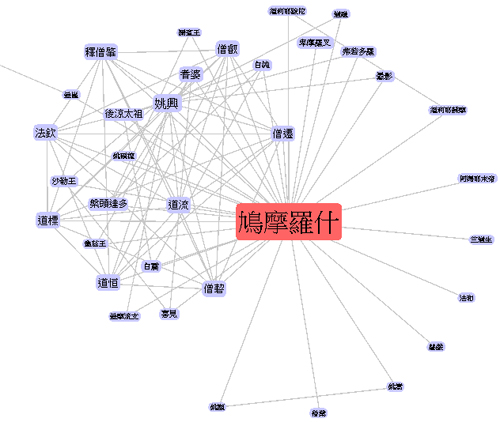 Fig 19: Social Networks of Eminent Buddhists JavaScript applet © Digital Archives, Dharma Drum Buddhist College
On the Web, the social networks are displayed as spring loaded nodal
points (JavaScript applet; Figure 19). However, for immersive
architectures such as AVIE, there is no intuitive way to visualize such a
social network as a 2D relationship graph in the virtual 3D space
provided by the architecture itself. Therefore, this project proposes an
effective mapping that projects the 2D relationship graph into 3D
virtual space and provides an immersive visualization and interaction
system for intuitive visualizing and exploring of social network using
the immersive architecture AVIE. The basic concept is to map the center
of the graph (the current focusing person) to the center of the virtual
3D world and project the graph horizontally on the ground of the virtual
space. This mapping provides an immersive visualization such that the
more related nodes will be closer to the center of the virtual world
(where the user is standing and operating). However, this will put all
the nodes and connections at the same horizontal level, and therefore
they will obstruct each other. To resolve this, nodes have been raised
according to their distances from the world center; i.e. the graph is
mapped on to a paraboloid such that farther nodes will be at a higher
horizontal level. This mapping optimizes the usage of 3D space and gives
an intuitive image to the user – smaller and higher objects are farther
from the user. In general, there are no overlapped nodes, as nodes with
different distances from the world center will have different heights;
thus the user views them with different pitch angles. The connections
between nodes are also projected on to the paraboloid such that they
become curve segments; viewers can follow and trace the connections
easily since the nodes are already arranged with different distances and
horizontal levels (Figures 20 & 21).
 Fig 20: Prototype of Social Networks of Eminent Buddhists, AVIE © ALiVE, CityU
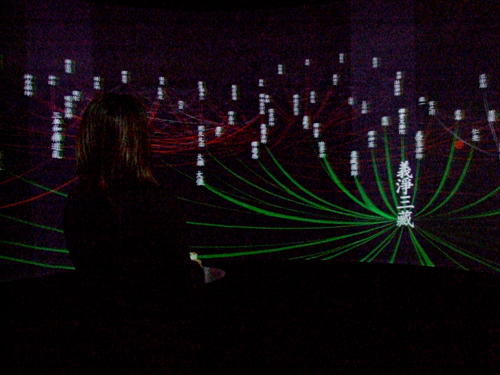 Fig 21: Researcher using Prototype of Social Networks of Eminent Buddhists, AVIE © ALiVE, CityU
To reduce the total number of nodes to be displayed and emphasize the
local relationship of the current focusing person, only the first two
levels of people related to the current focusing person are shown to the
user. Users can change their focus to another person by selecting the
new focusing person with the 3D pointer. The relationship graph updates
dynamically such that only the first two levels of relational are
displayed. Users can also check the biography of any displayed person by
holding the 3D pointer on the corresponding node. The biography of the
selected person will be displayed in a separated floating window. The
geospatial referencing and a dynamic GoogleEarth map are soon to be
implemented.
5. Conclusion
The projects described begin to take on core challenges of visual
analytics, multimedia analysis, text analysis and visualization inside
AVIE to provide powerful modalities for an omni-directional exploration
of museum collections, archaeological laser scan data and multiple
textual datasets. The research is responding to the need for embodied
interaction and knowledge-based interfaces that enhance collaboration,
cognition and perception, and narrative coherence. Through AVIE, museum
users and scholars are investigating the quality of narrative coherence
brought to interactive navigation and re-organization of information in
360-degree 3D space. There will be ongoing reporting related to the Data
Sculpture Museum, which has recently commenced as part of a three -ear
project, and the Blue Dots. Upcoming projects in AVIE include a
real-time visualization of the Israel Museum of Jerusalem Europeana
dataset (5000 records (http://www.europeana.eu))
that is looking for new ways to access museum collections with existing
(and constrained) metadata, and an interactive installation using laser
scan data from the UNESCO World Heritage site of the Dunhuang Caves,
Gobi Desert, China.
6. Acknowledgements:
The author would like to acknowledge the contribution of colleagues at ALiVE: Prof Jeffrey Shaw, William Wong and Dr Oscar Kin Chung Au.
Also the contributions of members of the Department of Chinese,
Translation and Linguistics, CityU, in relation to textual analytics,
Prof Jonathan Webster and Dr John Lee. The title of this paper, Cultural
Data Sculpting, is inspired Zhao & Vande Moere (2008).
Data Sculpture Museum: The narrative
reformulation of multiple forms of databases using a recombinatory model
of cinematic interactivity. Partners: UNSW iCinema Research
Centre, Museum Victoria, ZKM, City University of Hong Kong. Researchers:
Assoc Prof Dr Dennis Del Favero, Prof Dr. Horace Ip, Mr Tim Hart, Assoc
Prof Dr Sarah Kenderdine, Prof Jeffrey Shaw, Prof Dr Peter Wiebel. This
project is funded by the Australian Research Council 2011-2014.
Rhizome of the Western Han.
Partners: ALiVE, City University of Hong Kong, UC Merced, Researchers:
Assoc Prof Dr Sarah Kenderdine, Prof Maurizio Forte, Carlo Camporesi,
Prof Jeffrey Shaw.
Blue Dots AVIE: Tripitaka
Koreana Partners: ALiVE, City University of Hong Kong, UC Berkeley,
Researchers: Assoc Prof Dr Sarah Kenderdine, Prof Lew Lancaster, Howie
Lan, Prof Jeffrey Shaw.
Social Networks of Eminent Buddhists. Partners: ALiVE, City University of Hong Kong, Dharma Drum Buddhist College. Researchers: Assoc Prof Dr Sarah Kenderdine, Dr Marcus Bingenheimer, Prof Jeffrey Shaw.
7. References
Allosphere, Available (http://www.allosphere.ucsb.edu/). Consulted Nov 30, 2010.
Applied Laboratory for Interactive Visualization and Embodiment – ALiVE, CityU, Hong Kong Available (http://www.cityu.edu.hk/alive). Consulted Nov 30, 2010.
Bachelard, G. (1998), Poetic imagination and reveries (L’invitation au voyage 1971), Colette Guadin (trans.), Connecticut: Spring Publications Inc.
Bennett, J. (2008), T_Visionarium: a Users Guide, University of New South Wales Press Ltd.
Bennett, T. (2006), ‘Civic seeing: museums and the organization of vision’, in S. MacDonald (ed.), Companion to museum studies, Oxford: Blackwell, pp. 263-81.
Bingenheimer, Marcus; Hung, Jen-Jou; Wiles,
Simon: “Markup meets GIS – Visualizing the ‘Biographies of Eminent
Buddhist Monks’” in Proceedings of the International Conference on Information Visualization 2009 (Published by the IEEE Computer Society). DOI: 10.1109/IV.2009.91
Bingenheimer, M., Hung, J-J., Wiles, S. (2011): “Social Network Visualization from TEI Data”, Literary and Linguistic Computing Vol. 26 (forthcoming).
Blue Dots (http://ecai.org/textpatternanalysis/). Consulted Nov 30, 2010.
Bonini, E. 2008, ‘Building virtual cultural heritage environments: the embodied mind at the core of the learning processes’, in International Journal of Digital Culture and Electronic Tourism, vol. 2, no. 2, pp. 113-25.
Chan, S. 2007, ‘Tagging and searching: Serendipity and museum collection databases’, in Trant, J. & Bearman, D. (eds), Museums and the Web 2007, proceedings, Toronto: Archives & Museum Information. Available online (http://www.archimuse.com/mw2007/papers/chan/chan.html), Consulted June 20 2009.
Chinchor, N, Thomas, J., Wong, P. Christel, M.
& Ribarsky, W. (2010), Multimedia Analysis + Visual Analytics =
Multimedia Analytics, September/October 2010, IEEE Computer Graphics, vol. 30 no. 5. pp. 52-60.
Chion, M., et al.. (1994), Audio-Vision, Columbia University Press.
Christel, M.G. (2009), Automated Metadata in Multimedia Information Systems: Creation, Refinement, Use in Surrogates, and Evaluation. San Rafael, CA: Morgan and Claypool Publishers
Collins, C. Carpendale, S. & Penn, G.
(2009), DocuBurst: Visualizing Document Content using Language
Structure. Computer Graphics Forum (Proceedings of Eurographics/IEEE-VGTC Symposium on Visualization (EuroVis ‘09)), 28(3): pp.1039-1046.
Crowdbrowsing, KZM (2008a) [video] (http://container.zkm.de/cloudbrowsing/Video.html). Consulted Nov 30, 2010.
Crowdbrowsing, KZM (2008b) (http://www02.zkm.de/you/index.php?option=com_content&view=article&id=59:cloudbrowsing&catid=35:werke&Itemid=82&lang=en). Consulted Nov 30, 2010.
Del Favero, D., Ip, H., Hart, T., Kenderdine,
S., Shaw, J., Weibel, P. (2009), Australian Research Council Linkage
Grant, “Narrative reformulation of museological data: the coherent
representation of information by users in interactive systems”. PROJECT
ID: LP100100466
DeFanti, T. A., et al.. (2009). The StarCAVE, a third-generation CAVE & virtual reality OptIPortal. Future Generation Computer Systems, 25(2), 169-178.
Deleuze, G. (1989) Cinema 2: the Time Image. Translated by Hugh Tomlinson and Robert Galeta, Minnesota: University of Minnesota.
Electronic Cultural Atlas Initiative (www.ecai.org). Consulted Nov 30, 2010.
Forte, M. (2010), Introduction to Cyberarcheology, in Forte, M (ed) Cyber Archaeology, British Archaeological Reports BAR S2177 2010.
Green, T. M., Ribarsky & Fisher (2009), Building and Applying a Human Cognition Model for Visual Analytics. Information Visualization, 8(1), pp.1-13.
Harris, J. & Kamvar, S. (2009), We feel fine. New York, NY: Scribner.
Harrison, C. & Romhild, C. (2008), The Visualization of the Bible. (http://www.chrisharrison.net/projects/bibleviz/index.html). Consulted Nov 30, 2010.
Havre, S., et al.. (2000), ThemeRiver: Visualizing Theme Changes over Time. Proc. IEEE Symposium on Information Visualization, pp.115-123.
HIPerSpace CALIT2. (2010), Research Projects: HIPerSpace. (http://vis.ucsd.edu/mediawiki/index.php/Research_Projects:_HIPerSpace). Consulted Nov 30, 2010.
Horizon Report, 2010, Four to Five Years: Visual Data Analysis. Available from (http://wp.nmc.org/horizon2010/chapters/visual-data-analysis/). Consulted Nov 30, 2010.
Horizon Report, Museum edition, (2010). Available from (www.nmc.org/pdf/2010-Horizon-Report-Museum.pdf.) Consulted Nov 30, 2010.
Hung, J,J., Bingenheimer, M. & Wiles, S.
(2010), Digital Texts and GIS: The interrogation and coordinated
visualization of Classical Chinese texts” in Proceedings of the International Conference on Computer Design and Applications ICCDA 2010.
Kasik, D. J., et al.. (2009), Data transformations & representations for computation & visualization. Information Visualization 8(4), pp.275-285.
Keim, D. A., et al.. (2006), Challenges in Visual Data Analysis. Proc. Information Visualization (IV 2006), pp.9-16. London: IEEE.
Keim, D. A., et al.. (2008), Visual Analytics: Definition, Process, & Challenges. Information Visualization: Human-Centered Issues and Perspectives, pp.154-175. Berlin, Heidelberg: Springer-Verlag.
Schettino, P. & Kenderdine, S. (2010),
‘PLACE-Hampi: interactive cinema and new narratives of inclusive
cultural experience’, International Conference on the Inclusive Museum,
Istanbul, June 2010, Inclusive Museums Journal (In press).
Kenderdine, S. & Shaw, J. (2009), ‘New
media insitu: The re-socialization of public space’, in Benayoun, M.
& Roussou, M. (eds), International Journal of Art and Technology, special issue on Immersive Virtual, Mixed, or Augmented Reality Art, vol 2, no.4, Geneva: Inderscience Publishers, pp.258 – 276.
Kenderdine, S. (2010), ‘Immersive visualization architectures and situated embodiments of culture and heritage’ Proceedings of IV10 – 14th International Conference on Information Visualisation, London, July 2010, IEEE, pp. 408-414.
Kenderdine, S., Shaw, J. & Kocsis, A.
(2009), ‘Dramaturgies of PLACE: Evaluation, embodiment and performance
in PLACE-Hampi’, DIMEA/ACE Conference (5th Advances in Computer Entertainment Technology Conference & 3rd Digital Interactive Media Entertainment and Arts Conference), Athens, November 2008, ACM. Vol 422, pp. 249-56.
Kurillo, G. Forte, M. Bajcsy, R. (2010),
Cyber-archaeology and Virtual Collaborative Environments, in Forte, M.
(ed) 2010, BAR S2177 2010: Cyber-Archaeology.
Lancaster, L. (2007), The First Koryo Printed Version of the Buddhist Canon: Its Place in Contemporary Research. Nanzen-ji Collection of Buddhist Scriptures and the History of the Tripitake Tradition in East Asia. Seoul: Tripitaka Koreana Institute.
Lancaster, L. (2008a), Buddhism & the New Technology: An Overview. Buddhism in the Digital Age: Electronic Cultural Atlas Initiative. Ho Chi Minh: Vietnam Buddhist U.
Lancaster, L. (2008b), Catalogues in the Electronic Era: CBETA and The Korean Buddhist Canon: A Descriptive Catalogue. Taipei: CBETA (electronic publication).
Lancaster, L. (2010), Pattern Recognition & Analysis in the Chinese Buddhist Canon: A Study of “Original Enlightenment”. Pacific World.
Latour, Bruno. (1988). Visualisation and
Social Reproduction. In G.Fyfe and J. Law (Eds.). Picturing Power:
Visual Depiction and Social Relations. London: Routledge. 15-38.
Liu, S., et al. (eds.) (2010), Proc. 1st Int. Workshop on Intelligent Visual Interfaces for Text Analysis, IUI’10.
Manovich, L. (2008), The Practice of Everyday
(Media) Life. In R. Frieling (Ed.), The Art of Participation: 1950 to
Now. London: Thames and Hudson.
Manovich, L. (2009), How to Follow Global Digital Cultures, or Cultural Analytics for Beginners. Deep Search: They Politics of Search beyond Google. Studienverlag (German version) and Transaction Publishers (English version).
Many Eyes. (http://www.manyeyes.alphaworks.ibm.com). Consulted Nov 30, 2010.
Maturana, H. & Varela, F. (1980), Autopoiesis and cognition: The realization of the living, vol. 42, Boston Studies in the Philosophy of Science, Dordrecht: D. Reidel.
McCandless, D. (2010.) The beauty of data visualization [Video file]. (http://www.ted.com/talks/lang/eng/david_mccandless_the_beauty_of_data_visualization.html). Consulted Nov 30, 2010.
McGinity, M., et al. (2007), AVIE: A Versatile Multi-User Stereo 360-Degree Interactive VR Theatre. The 34th Int. Conference on Computer Graphics & Interactive Techniques, SIGGRAPH 2007, 5-9 August 2007.
National Science Foundation, (2007), Cyberinfrastructure Vision for 21st Century Discovery. Washington: National Science Foundation.
Nechvatal, J. (2009), Towards an Immersive Intelligence: Essays on the Work of Art in the Age of Computer Technology and Virtual Reality (1993-2006) Edgewise Press, New York, NY.
Paley, B. 2002. TextArc (http://www.textarc.org). Consulted Nov 30, 2010.
Pearson, M. & Shanks, M. (2001) Theatre/Archaeology, London: Routledge.
Pike, W. A., et al. (2009), The science of interaction. Information Visualization, 8(4), pp.263-274.
Ricoeur, P. (2004), Memory, History, Forgetting, University of Chicago Press.
Speer, R., et al.. (2010), Visualizing Common Sense Connections with Luminoso. Proc. 1st Int. Workshop on Intelligent Visual Interfaces for Text Analysis (IUI’10), pp.9-12.
Springer, Michelle et al. (2008), For the Common Good: the Library of Congress Flickr Pilot Project. http://www.loc.gov/rr/print/flickr_report_final.pdf Consulted: 8/02/2009.
T_Visionarium (2003-2008), (http://www.icinema.unsw.edu.au/projects/prj_tvis_II_2.html). Consulted Nov 30, 2010.
Thai, V. & Handschuh, S. (2010), Visual Abstraction and Ordering in Faceted Browsing of Text Collections. Proc. 1st Int. Workshop on Intelligent Visual Interfaces for Text Analysis (IUI’10), pp.41-44.
Thomas, J. & Kielman, J. (2009), Challenges for visual analytics. Information Visualization, 8(4), pp.309-314.
Tilley, C. 2008, Body and image: Explorations in landscape phenomenology, Walnut Creek: Left Coast Press.
Visnomad. (www.visnomad.org). Consulted Nov 30, 2010
Visual Complexity. (www.visualcomplexity.com/). Consulted Nov 30, 2010
Wattenberg, M. (2002), Arc Diagrams: Visualizing Structure in Strings. Proc. IEEE Symposium on Information Visualization, pp.110-116. Boston, MA.
West, R., et al. (2009), Sensate abstraction: hybrid strategies for multi-dimensional data in expressive virtual reality contexts. Proc. 21st Annual SPIE Symposium on Electronic Imaging, vol 7238 (2009), 72380I-72380I-11.
ZKM Centre for Art and Media (http://on1.zkm.de/zkm/e/). Consulted Nov 30, 2010
Zhao J. and Vande Moere A. (2008), “Embodiment
in Data Sculpture: A Model of the Physical Visualization of
Information”, International Conference on Digital Interactive Media in
Entertainment and Arts (DIMEA’08), ACM International Conference
Proceeding Series Vol.349, Athens, Greece, pp.343-350.
Zielinski, S. (2006), Deep time of the media: Toward an archaeology of hearing and seeing by technical means, Custance, G. (trans.), Cambridge, MA: MIT Press.


 http://dhammadharo.wordpress.com/
 Figure
  (Figure 3).

